

Devices · AirWatch
The sensor behind it all
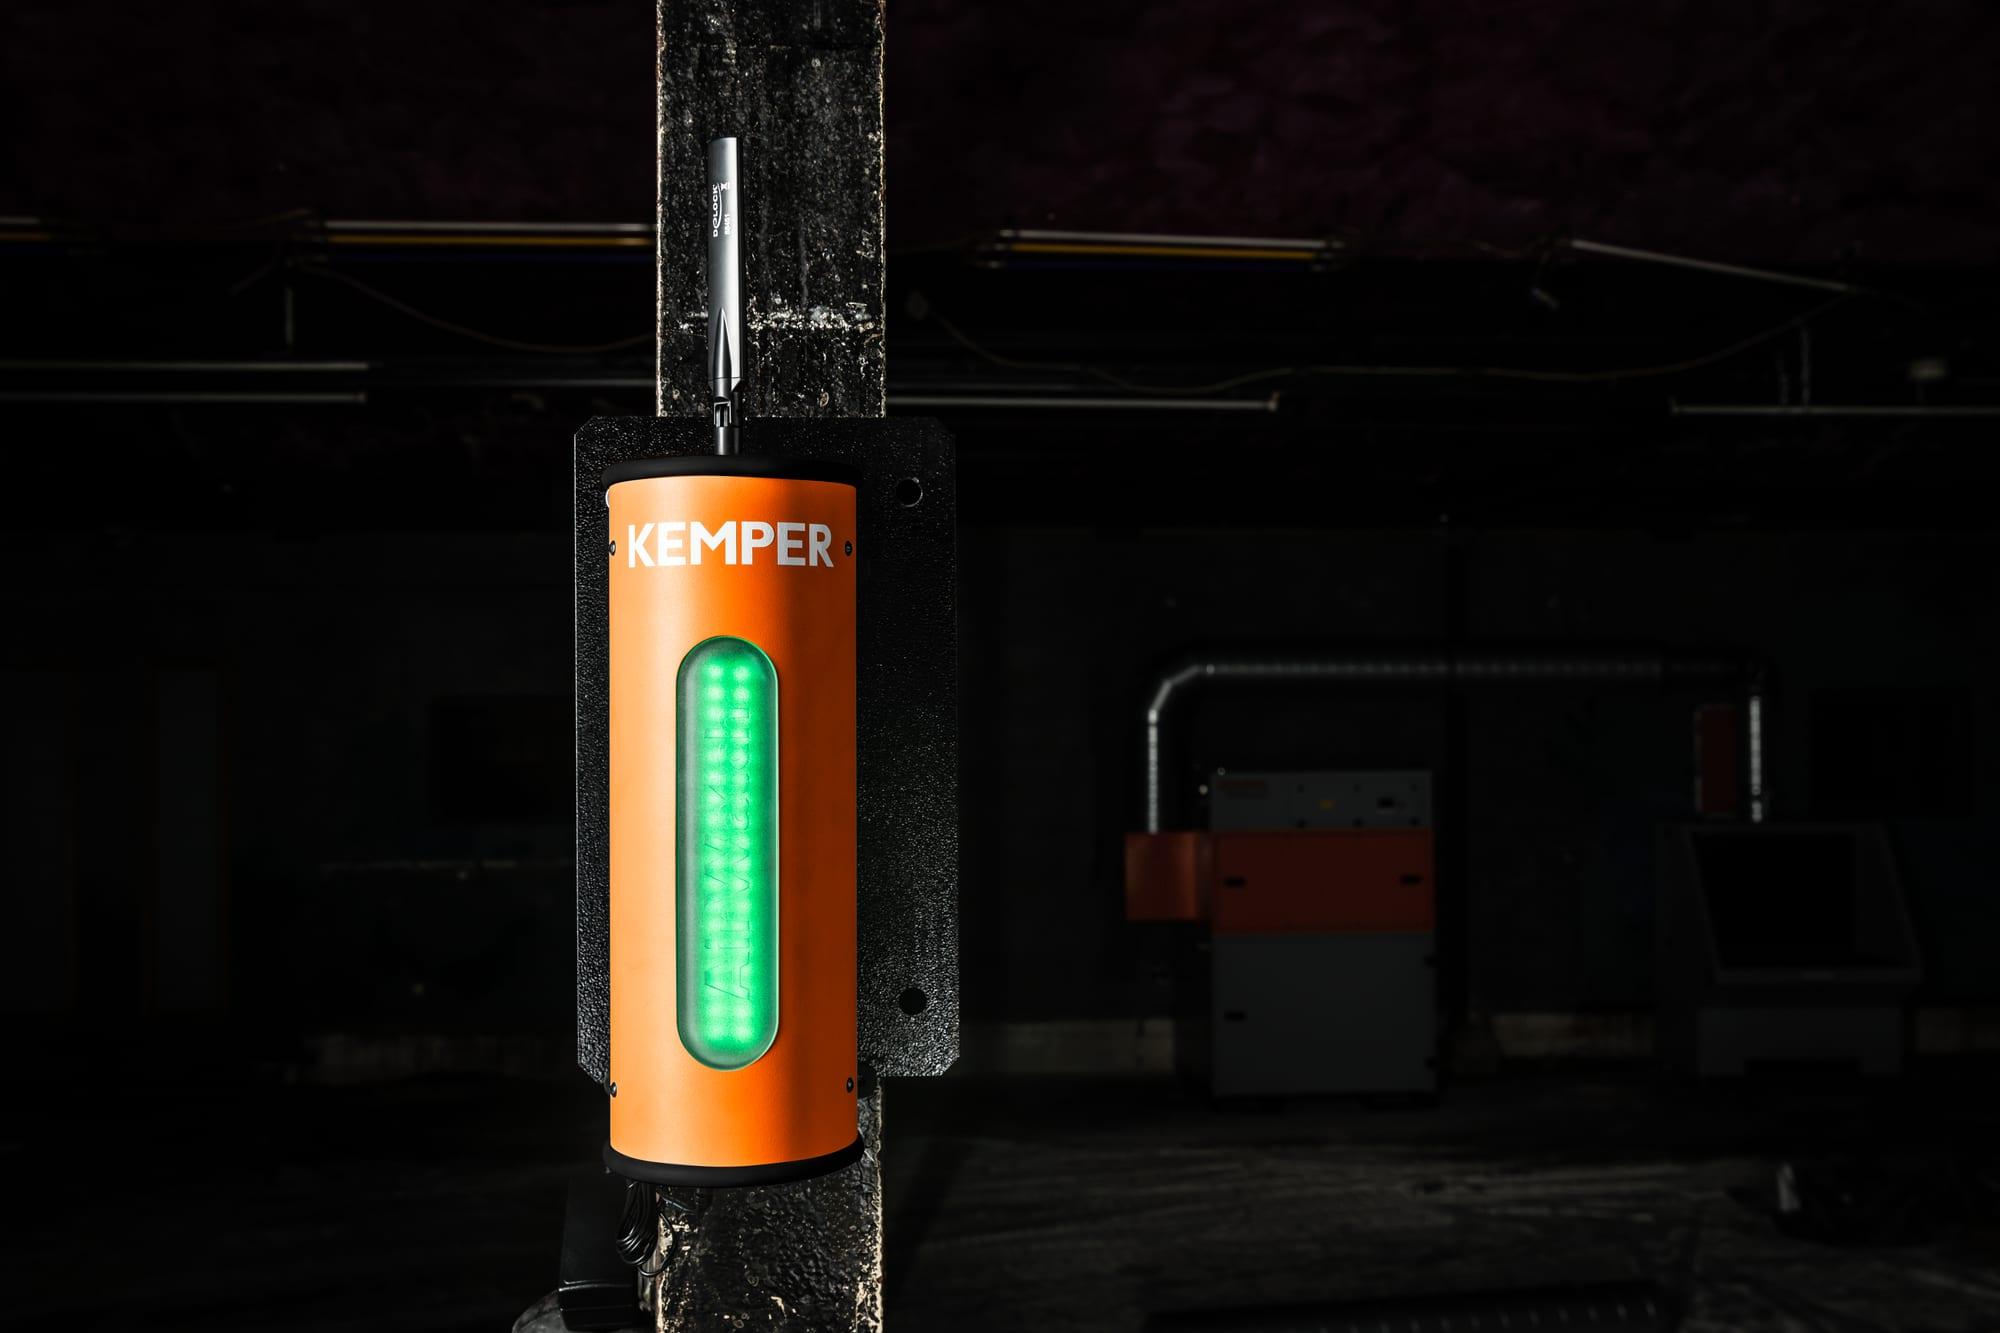
The KEMPER AirWatch measures welding fumes and particulate matter in the hall air. In KEMPER Connect it becomes a traffic light, a record, and a trigger: all air quality evaluations, the Rule Engine, basic automation, and email notifications build on it.
AirWatch
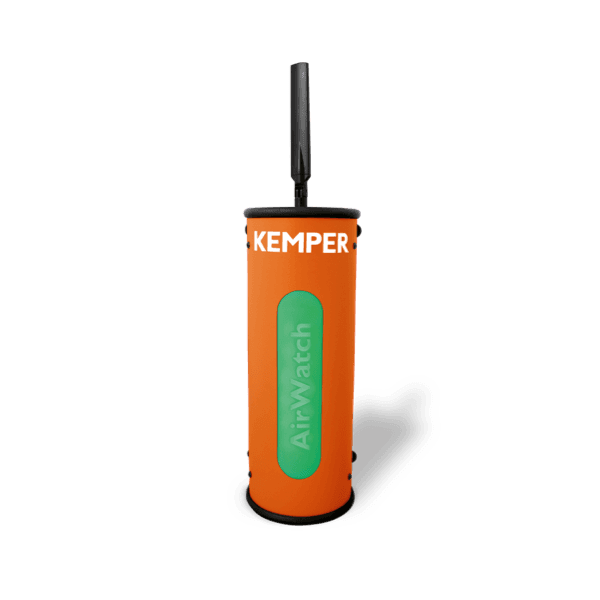
Connection: nativeAir quality sensor for particulate matter PM2.5 and PM10 and the particle size distribution. Variants: AirWatch 3.0, AirWatch LTE Europe, AirWatch LTE America. Connects natively with the serial number and PIN from the nameplate.
What you see
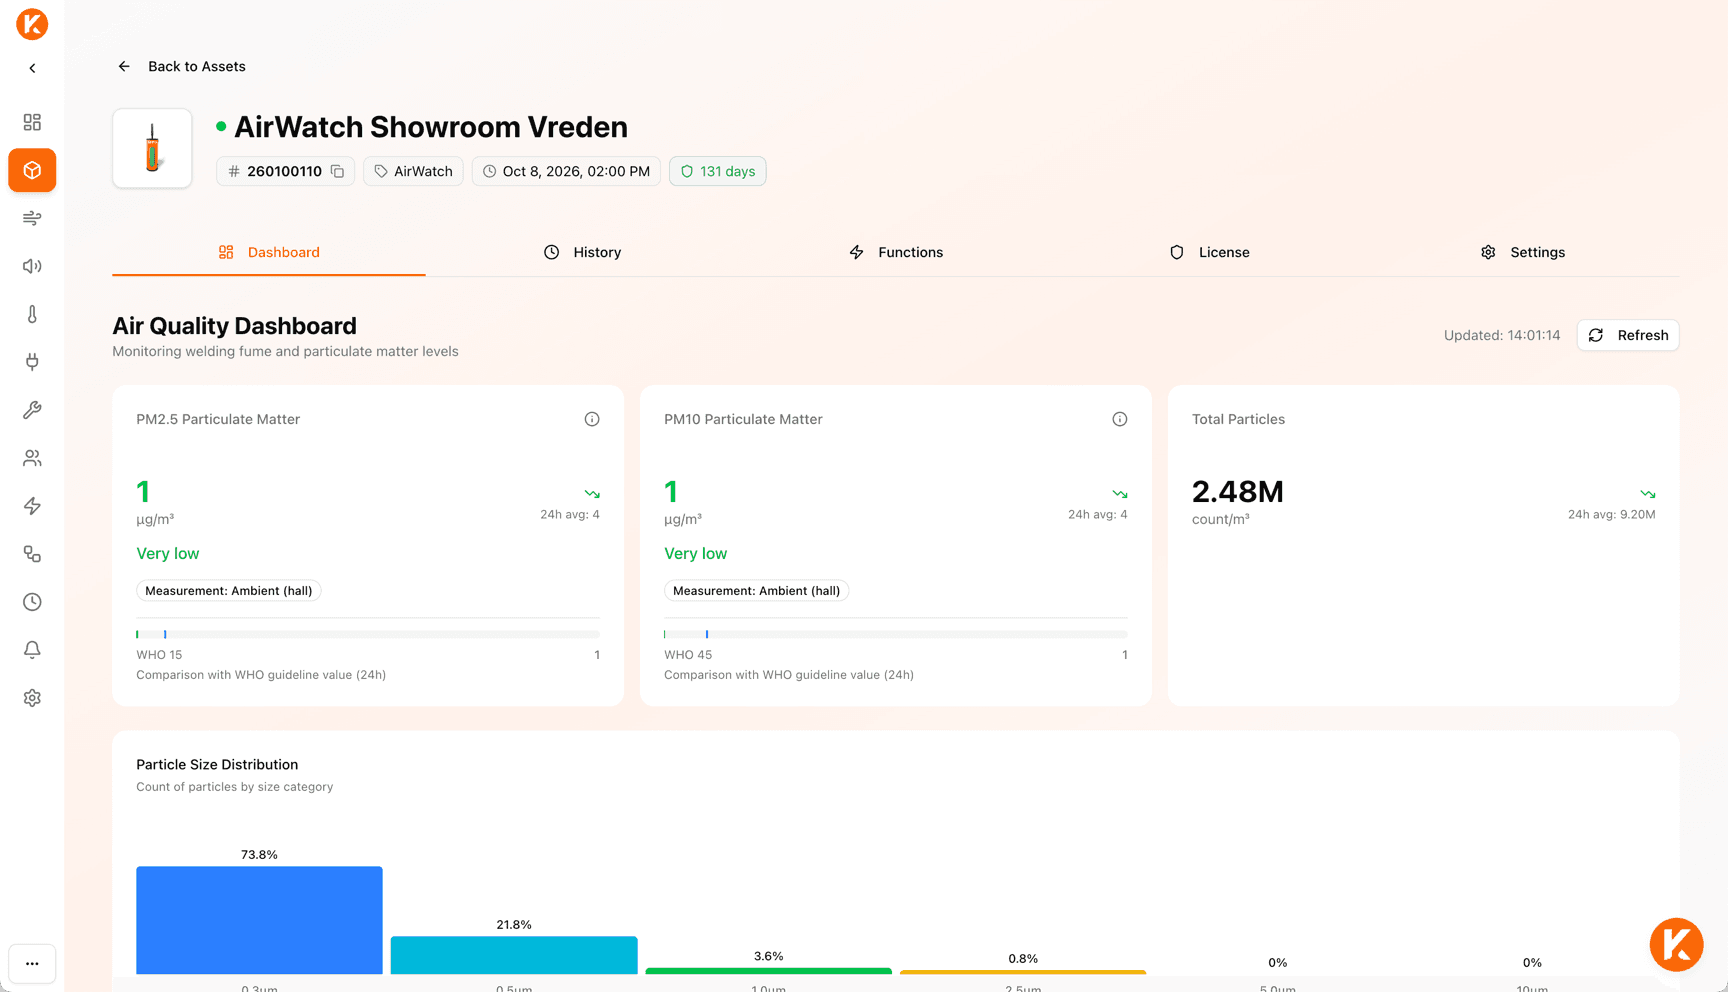
- Current particulate matter values PM2.5 and PM10, color-coded as a traffic light in five levels: Very good, Elevated, High pollution, Very high pollution, Extreme.
- Trend arrow compared with the 24-hour average (rising, falling, stable).
- Comparison with the WHO 24-hour guideline value as a bar with a marker, including the note that industrial environments are typically above it and that this is an ambient measurement.
- Total particle count with 24-hour average and trend.
- Particle size distribution in six size classes from above 0.3 µm to above 10 µm as a bar chart.
- 24-hour history of PM2.5 and PM10 at 5-minute resolution.
What you evaluate
- Periods day, week, month, or custom, with paging through past periods.
- Comparison with the previous period as a dashed line, change in percent (“Increased by 12 % from 38 to 43 µg/m³”).
- Working hours filter: statistics only for the shift time (default 06:00 to 16:00, weekends excluded).
- Statistics per pollutant: average, minimum, maximum, median. Time distribution by pollution level with duration in hours and minutes.
- Export as CSV or Excel, optionally with statistics block, time distribution, comparison period, and working hours filter, resolution 5 minutes to 1 day.
- PDF device report for day or week with cover page, executive summary, full-page chart, statistics, exceedances, peak events, and methodology.
What you can do
- “Fetch data now”: the sensor immediately sends current readings (AirWatch 3.0 and LTE Europe).
- “Identify device”: the sensor blinks so you can find it in the hall.
- Settings: LED brightness on the device, PM10 alarm threshold (written to the device), display of the transmission interval, device model, and purpose.
In automation
- The only trigger for the Rule Engine, basic automation, and email notifications. Any number of AirWatch per rule; by default the worst sensor counts.
- Provides the data for the site-wide air quality page and the site PDF report.
The value
Objective, continuously documented air quality with recognized reference values that can be shared as a report and at the same time controls the extraction automatically.
Features at a glance
- Connection
- native
- History
- day, week, month, custom period
- Comparison with previous period
- yes
- Working hours filter
- yes
- Export
- CSV / Excel
- PDF report per device
- yes
- Remote control
- Fetch data, Identify
- Writable device settings
- LED, PM10 threshold
- Rule Engine
- Sensor
- Email notification
- Trigger
- Site page
- Air quality