

Reports and exports
Evidence that makes sense even without platform access
For occupational safety, management, auditors, and the works council: print-ready PDF reports on air quality and noise, a service report for the service partner, and measurement data exports for your own analyses.
Overview
Which report for whom
| Report / export | Where | Content | Format |
|---|---|---|---|
| Air quality report, site | Air Quality, “Report” tab | Cover page with customer, project, notes, and executive summary, table of contents, overall status, key figures, full-page history chart with pollution zones, statistics, time distribution, exceedance analysis, peak events, optionally a table of all devices and one page per sensor, methodology page | PDF (browser print, A4 landscape) |
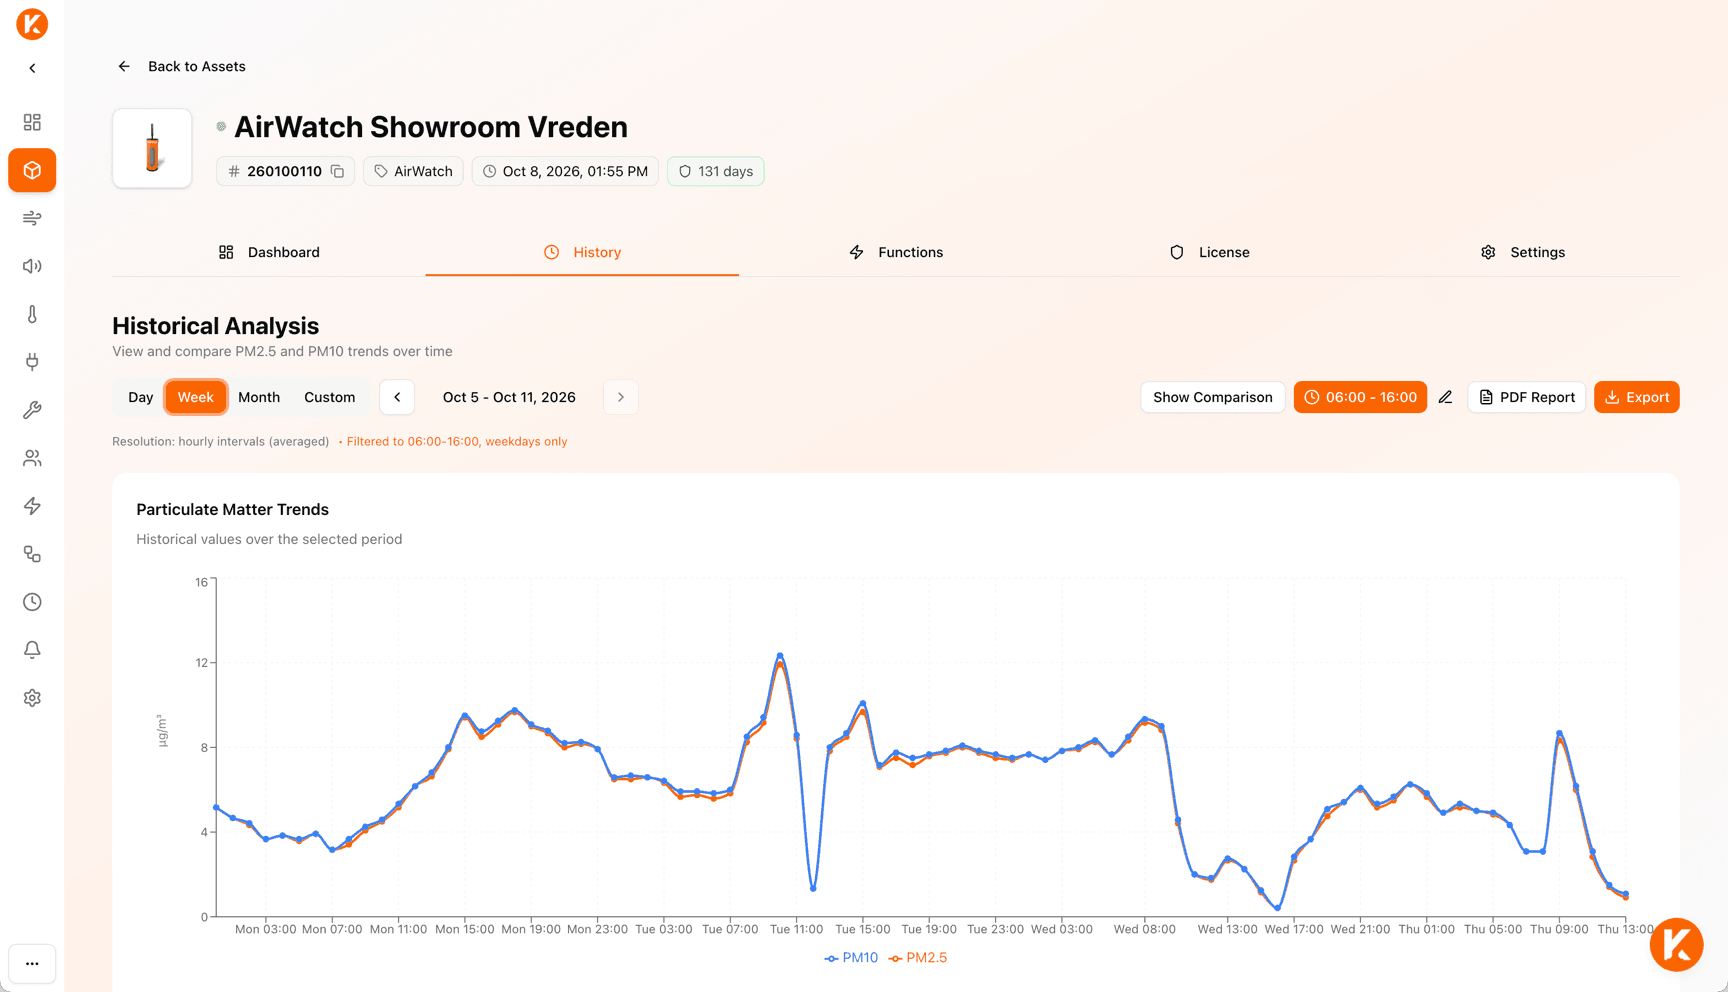
| Air quality report, single device | AirWatch, History, “PDF Report” | As above, for one sensor | |
| Noise report, site | Noise Level, “Report” tab | Same structure; exceedances against 80, 85, and 87 dB(A), optionally one page per sensor | |
| Service report | Service | All devices with service status, operating hours, error and warning codes including description; pre-written email to the service partner | CSV (Excel-compatible) |
| Measurement data export | History of AirWatch, noise sensor, air quality, noise, energy, and units on the IoT Kit | Raw data of the selected period; for AirWatch with selectable resolution (5 minutes to 1 day), statistics block, time distribution, and comparison period | CSV / Excel |
Structure
From cover page to methodology
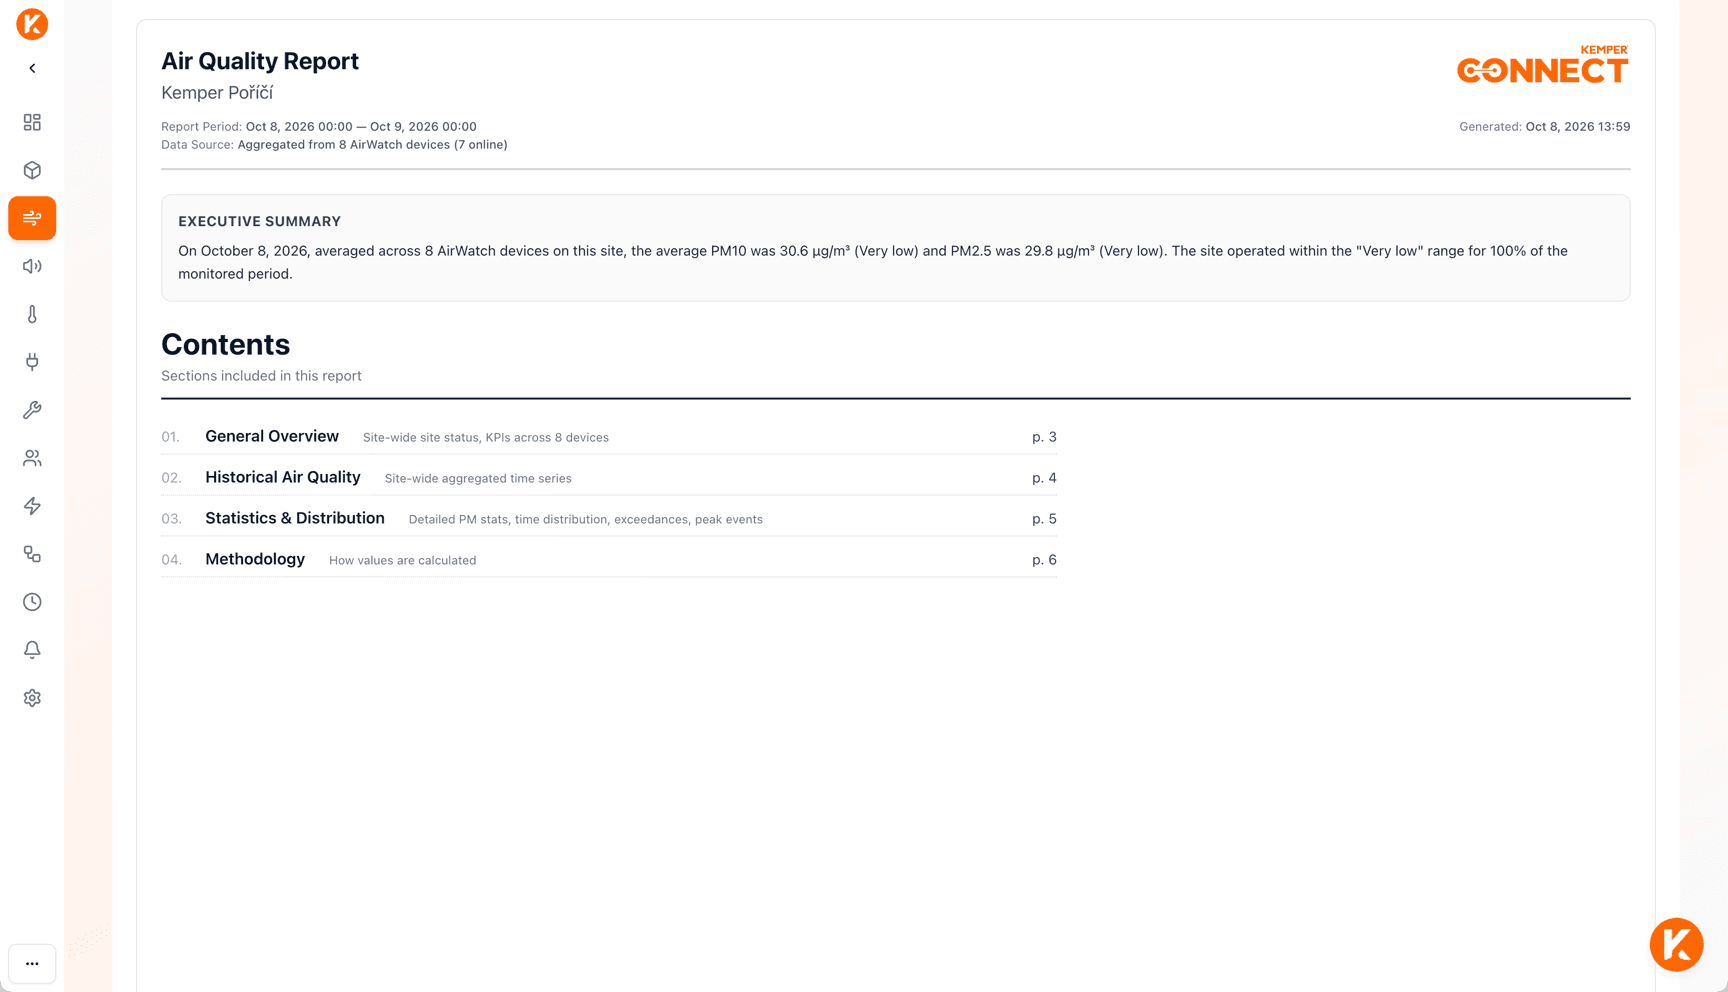
The PDF reports follow a fixed structure: cover page with free text fields for customer or company, project or site, and notes, plus an executive summary. Then table of contents, overall status, key figures, a full-page history chart with colored pollution zones, statistics, and time distribution.
The exceedance analysis names duration, share, and number of events per level, plus the peak events. Optionally, a table of all devices and one page per sensor follow. Every report ends with a methodology page that explains reference values and measurement methods.
Options
Set before printing
Period
Day or week, with paging into the past.
Comparison with the previous period
A dashed line and trend arrows show how the exposure has changed compared with the previous day or the previous week.
Working hours filter
Start, end, and exclude weekends. The setting is documented on the cover page so that it is clear what the statistics refer to.
Chart size and preview
Choose the chart size and check the report in the preview before printing.
Cover page fields
Customer or company, project or site, and notes as free text.
Page per sensor
Optionally, every sensor on the site gets its own page with history and statistics.
For whom
Readable for everyone involved
Occupational safety and safety officers
Document exposure: air quality and noise by area and shift, exceedances against recognized reference values, working hours filter for shift hours only.
Auditors, works council, management
The methodology page makes every report understandable for readers without platform access. Executive summary on the cover page.
Maintenance and service partners
The service report as CSV lists all units with status, hours, and codes and goes to the KEMPER service partner by pre-written email.
Scope
The reports rate ambient measurements against reference values such as the WHO guideline value or the action values 80 and 85 dB(A). They explicitly point out that these are not personal exposure measurements.
The PDF reports for air quality and noise are currently in English; the configuration is bilingual. For the indoor climate there is no PDF report and no export; the energy page offers the export as CSV or Excel.
Frequently asked questions
See a report from real measurement data.
In a demonstration we generate an air quality report and go through it page by page.